

On the daily chart, Ethereum is trading just above $3,100, sitting over the 20‑day EMA but still below the 50‑day and 200‑day moving averages. This usually signals a market trying to recover from a down phase, with short‑term buyers active but the broader trend still in repair mode.
Daily RSI is parked near the neutral 50 line, suggesting momentum is balanced rather than stretched in either direction. In this kind of environment, ETH tends to oscillate between support and resistance instead of trending in a straight line, so traders are better off thinking in terms of levels, ranges, and rotations.
Key technical signals to watch
On the daily timeframe, MACD has turned higher and crossed above its signal line, but both remain below zero, which fits the profile of early bullish momentum inside a still‑weak trend. That often acts like a relief bounce that can evolve into a genuine trend change if buyers consistently step in on pullbacks.
Daily Bollinger Bands show ETH trading slightly above the mid‑band and comfortably inside the upper and lower bands, pointing to moderate volatility and consolidation rather than a fresh breakout. With ATR implying typical daily swings of roughly 5–6%, a move of $150–$200 in either direction is “normal noise” and not automatically a trend reversal.
Practical tip: When volatility is elevated, widen stop losses relative to ATR and size positions smaller so random daily moves do not knock you out of otherwise valid trades.
Short-term vs higher timeframes
On the 1‑hour chart, ETH trades above its short‑term EMAs while pressing into the 200‑period EMA, which often acts as intraday resistance. With RSI holding above 50 and MACD in positive territory on this timeframe, the bias is modestly bullish, but not strong enough to call it a runaway trend.
On the 15‑minute chart, price action looks noisy and choppy, with ETH hovering near intraday pivot levels and testing the lower side of its local Bollinger range. This micro‑range mostly reflects execution noise—helpful for timing entries and exits—but it should not override signals from the higher timeframes.
Practical tip: Use higher timeframes (daily, 4H, 1H) to define direction, and lower timeframes (15m, 5m) only to refine entries, stop placement, and take‑profit levels.
Macro backdrop: fear, BTC dominance, and DeFi softness
The broader crypto market cap sits in the multi‑trillion range, while Bitcoin dominance in the mid‑50% zone confirms a BTC‑led market where altcoins like Ethereum are more reactive than proactive. At the same time, the Crypto Fear and Greed Index at 16 highlights extreme fear, with many traders staying defensive or parked in stablecoins.
In DeFi, major protocols such as Uniswap and Curve have seen weaker fee revenues and softer on‑chain activity, pointing to reduced organic demand for Ethereum blockspace. That backdrop limits aggressive upside for ETH until DeFi volumes and on‑chain usage start to recover, but it also helps flush out speculative excess and supports the idea of a slow accumulation base.
Bullish scenario: what ETH needs to prove
In a bullish Ethereum price scenario, the current consolidation above $3,000 becomes the foundation for a sustained recovery. For bulls, the checklist looks like this:
- Hold $3,000–$3,070 as support
Repeated bounces from this area confirm it as a structural floor rather than a topping zone. - Daily closes above $3,190–$3,200
A break and hold above this resistance band shows the market is willing to accept higher prices despite the fearful sentiment. - Reclaim the 50‑day EMA (low‑$3,200s to ~$3,280)
Once ETH closes above this level and it acts as support on pullbacks, the bias shifts from “repair” to a credible medium‑term uptrend attempt. - Stronger momentum on daily RSI and MACD
RSI grinding into the 55–60 zone and MACD moving toward or above zero would suggest the bounce has real trend strength behind it.
If this bullish path plays out, logical upside waypoints include the upper daily Bollinger Band in the low‑$3,300s, then the 200‑day EMA around the low‑$3,400s, and eventually prior swing highs around $3,600–$3,800 if momentum and DeFi activity improve together.
Bearish scenario: where it can break down
In the bearish Ethereum price scenario, the current bounce is just a pause in a larger downtrend. Bears are watching for:
- Repeated failures at $3,190–$3,200
Multiple rejections near this zone, especially with softening intraday RSI and a rolling‑over MACD, would reinforce it as a short‑term top. - A decisive break of $3,070 and then $3,000
A strong move below these levels, backed by higher volume and wide daily candles, would signal a return to trend‑down behavior. - Daily closes near or under the lower Bollinger Band below roughly $2,900
That pattern often marks a volatility expansion to the downside, typical of a new leg lower rather than another range dip. - Momentum rolling over on RSI and MACD
Daily RSI drifting toward 40 or below and MACD turning more negative suggest sellers have regained control.
In that case, natural downside targets include the mid‑$2,800 region around the lower daily Bollinger Band, followed by deeper structural supports in the $2,600–$2,700 area, where longer‑term participants may look for value.
How smart traders can position now
Right now, Ethereum sits in a classic indecision zone: short‑term charts lean slightly bullish, higher timeframes are still healing, and sentiment is deeply fearful. That mix tends to favor range trading and two‑way strategies over “all‑in” trend‑following.
A practical way to think about it:
- For upside exposure, many traders prefer to wait for daily closes above $3,190–$3,200, then look for pullbacks to that area to hold as support before increasing position size.
- For downside hedging, a clean daily close below $3,000, especially if ATR is rising, often acts as a trigger to de‑risk or consider tactical shorts.
- With daily ATR in the mid‑hundreds, risk plans should assume several hundred dollars of movement inside a normal swing, so stops that are too tight relative to volatility are likely to get chopped out.
Whatever the bias, it pays to match position size to volatility and personal risk tolerance, not to the level of fear or hype on social media.
Conclusion
Ethereum is defending the $3,000 zone in a market dominated by Extreme Fear, a combination that often precedes either powerful bases or sharp breakdowns. Right now, the chart is in repair and consolidation mode, with clear bullish and bearish paths defined by a handful of well‑known levels and indicators.
If you want an edge, focus less on guessing the next $100 candle and more on preparing for the larger move once this range finally breaks. Tighten your plan, define your key levels around $3,000, $3,070, and $3,190–$3,200, and align your risk management with current volatility—then let the market show its hand.
If you’re serious about trading ETH with confidence instead of emotion, now is the time to build a clear, rules‑based strategy and commit to following it on the next big move.
FAQ’s
Is Ethereum bullish or bearish right now?
Ethereum currently sits in a neutral‑to‑cautiously‑bullish zone, with price above the 20‑day EMA but still below the 50‑day and 200‑day, and momentum improving without confirming a full uptrend. That points to recovery mode rather than a mature bull market.
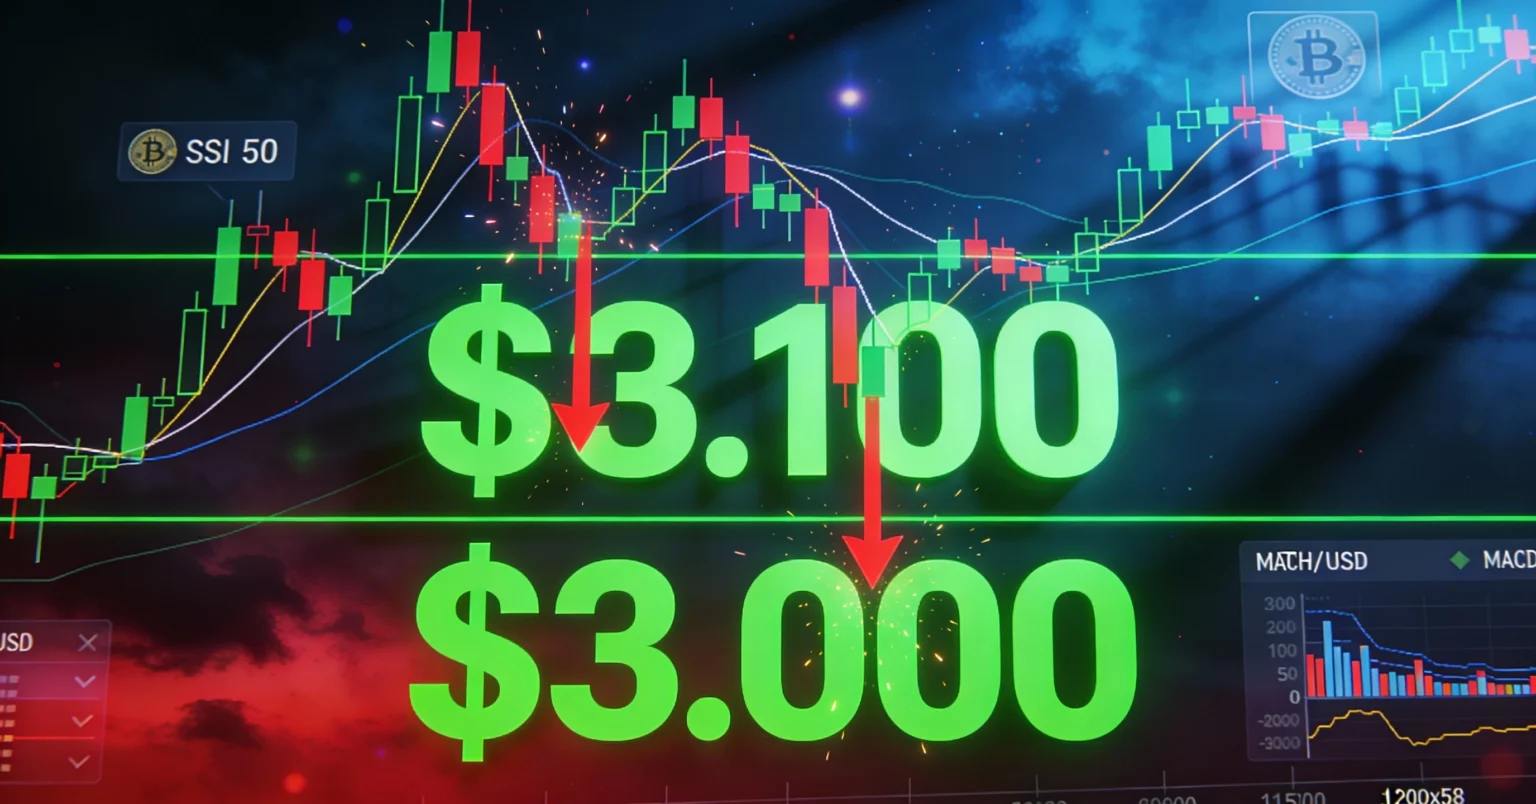
Why is the $3,000 level so important for ETH?
The $3,000 area is both psychological and technical support, with key pivot and support levels clustering nearby. Holding above this region supports the base‑building narrative, while a breakdown would reopen downside toward lower structural levels.
Which indicators matter most for ETH right now?
The most useful tools in this environment are EMAs (20, 50, 200), RSI, MACD, Bollinger Bands, ATR, and daily pivot points, which together highlight trend strength, momentum, volatility, and high‑reaction zones. Many crypto traders also track the Crypto Fear and Greed Index to gauge sentiment around Ethereum and the broader market.
Does Extreme Fear mean it’s time to buy Ethereum?
Extreme Fear often appears near attractive long‑term areas, but it is not a standalone buy signal. Combining sentiment with clear technical levels and a risk‑managed plan is much more reliable than trading the index alone.
Is this financial advice?
No. This analysis is for educational and informational purposes only and should not be the sole basis for any investment or trading decision. Crypto assets are highly volatile and risky, so always do your own research and make sure any position fits your personal risk tolerance and financial situation.